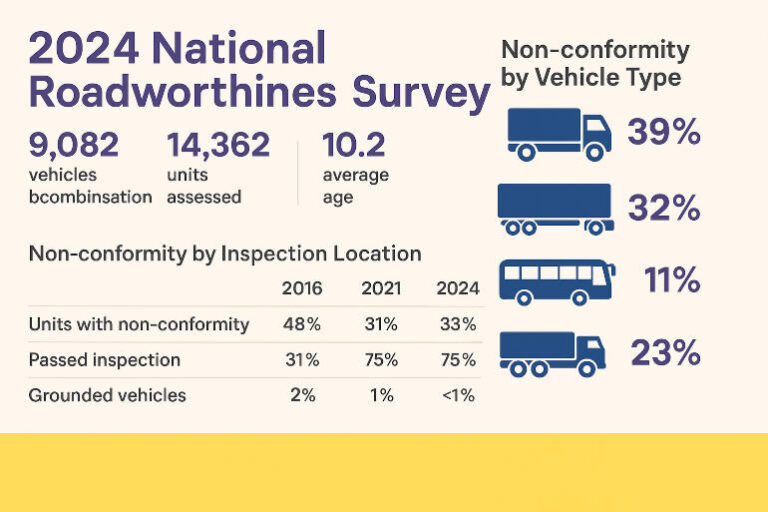
The NHVR’s 2024 National Roadworthiness Survey reveals steady progress in heavy vehicle safety since 2016—but signs of plateauing raise new challenges. Here’s the key findings and risks.
A National Health Check for Heavy Vehicles
The National Heavy Vehicle Regulator (NHVR) has released the results of its third National Roadworthiness Survey (NRS), conducted in 2024. Following earlier surveys in 2016 and 2021, the latest findings offer a detailed snapshot of the condition of Australia’s heavy vehicle fleet. While some improvements have been maintained, there are signs that progress is beginning to stall.
This article outlines the key results, compares them with earlier surveys, and highlights ongoing risks and opportunities for improvement.
At a Glance: 2024 Key Statistics
- 9,082 vehicles and combinations inspected
- 14,362 units (powered and trailers) assessed nationally
- 10.2 years – average vehicle age
- 316,000km – median mileage for powered units
- 33% of units had at least one non-conformity (up from 31% in 2021)
- 75% of units passed inspection (unchanged from 2021, up from 55% in 2016)
- Brakes, lights & reflectors, and structure & body remain top defect areas
Comparing 2024 with Previous Surveys
| Metric | 2016 | 2021 | 2024 |
|---|---|---|---|
| Vehicles inspected | 7,130 | 8,338 | 9,082 |
| Units inspected | 11,066 | 13,325 | 14,362 |
| Units with non-conformity | 48% | 31% | 33% |
| Passed inspection | 55% | 75% | 75% |
| Minor defect rate | 34% | 19% | 21% |
| Major defect rate | 10% | 5% | 3% |
| Grounded vehicles | 2% | 1% | <1% |
The data shows clear improvement from 2016, particularly in reducing major defects and grounding events. However, the slight increase in overall non-conformity since 2021 suggests that earlier gains may be levelling off.
Where Are the Defects? Top 5 Trouble Areas
The survey confirms that five areas continue to account for most non-conformities:
- Brakes – 14% of units, unchanged from 2021, down from 25% in 2016
- Lights & reflectors – increased to 10%, up from 9% in 2021
- Structure & body – rose to 8%, from 6% in 2021
- Engine driveline & exhaust – up to 7% nationally
- Steering & suspension – improved slightly to 6%, down from 7% in 2021
While brakes remain the top issue across all areas, the most notable increases were in lights and reflectors, structure and body, and engine-related defects.
Vehicle Type Breakdown: Rigid Trucks Still Lead
Non-conformity by vehicle type shows consistent patterns:
- Rigid trucks: 39% non-conforming — highest of all categories, slightly up from 38% in 2021 but well below 52% in 2016
- Semi-trailers: 32% (unchanged)
- B-doubles and road trains: 23%
- Buses and coaches: increased to 11%, up from 8% in 2021, though far below 30% in 2016
- Plant/special purpose vehicles (SPV): rose to 20%, from 13% in 2021
These figures highlight progress across the board compared to 2016, though bus and plant operators may need to refocus attention on safety standards.
Metro vs Regional vs Interstate: Minimal Variation
The location of inspection did not significantly affect overall compliance rates:
- Metro inspections: 33% non-conformity
- Regional inspections: 32%
- Interstate inspections: 31%
While some variation exists between home-state and interstate inspections, the differences are minor. For example, brake-related non-conformities were slightly higher in interstate inspections (16%) compared to home-state inspections (14%), while structure and body defects were more common in home-state inspections (8% vs 5%). These small differences suggest that the location of inspection—whether interstate or within the vehicle’s registration state—does not significantly influence overall compliance outcomes, indicating consistent enforcement standards across jurisdictions.
What’s Improved — and What Hasn’t
Improved areas since 2021:
- Steering and suspension – slight national improvement
- Major defects and vehicle grounding – both continued to decline
- Pass rate – remains stable at 75%, sustaining the large leap from 2016
Areas needing attention:
- Lights and reflectors – defect rate rose to 10%
- Structure and body – increased to 8% nationally
- Plant/SPV and bus categories – non-conformity rates up from 2021
Risks Read: Signals of Plateauing
The 2024 survey sends a subtle but important warning: after significant improvement between 2016 and 2021, gains may now be flattening. With non-conformity inching up by two percentage points, and some defect types rising, regulators and operators alike must be cautious about complacency.
The increase in non-conformities for buses, SPVs, and lighting systems is particularly concerning, as these can directly affect public safety, visibility, and vehicle reliability.
What the Industry Can Take Away
The NHVR’s 2024 National Roadworthiness Survey provides a wealth of insight for fleet managers, operators, safety officers, and regulators. Key takeaways include:
- Routine maintenance remains critical – especially for brake systems and lighting
- Data-driven monitoring works – the dramatic fall in defects since 2016 shows the impact of targeted compliance and enforcement
- Focus must continue – with some indicators trending upward again, sustained attention is essential
Conclusion: Progress Maintained, But Momentum Must Continue
The 2024 Roadworthiness Survey confirms that the Australian heavy vehicle fleet has come a long way since 2016, with significantly fewer major defects and a consistently high inspection pass rate. However, the marginal uptick in non-conformities and issues in specific vehicle categories point to the need for renewed vigilance.
As the NHVR notes, “the incidence of non-conformity remains well below 2016 levels” — but now the challenge is ensuring it stays that way.


